When it comes to learning how to read crypto charts, it is no secret that candlestick chart patterns are the most powerful trading indicators for signalling major price movements in the market.
Table of Contents
How to Read Candlesticks
Discovering how to read crypto charts will involve understanding candlestick patterns, which form a very powerful aspect of technical analysis. Basic candlestick patterns & technical analysis techniques tend to produce accurate results, perfect for cryptocurrency trading newbies.
Acquiring the skills on how to read crypto charts will help you to determine trend changes within the market. Whether the price of a crypto is going up or down, basic candlestick patterns can easily inform you about what might be heading your way.
Anyone can learn how to read a candlestick chart, and the beauty of it is that they are perfect for all financial markets including Stocks, Forex & Cryptocurrency markets. Candlestick charts can be used on any charting timeframe, making them ideal for all levels of experience.
When candlestick patterns are combined with other trading techniques such as moving averages, traders can find confluence in these strategies, resulting in powerful signals that are highly probable.

This article aims to guide you on the basic principles of how to read crypto charts.
After reading this article, you should be able to identify candlesticks accurately and correctly on any crypto trading chart. You will be able to interpret the information represented by a candlestick and understand how candlestick patterns are formed.
So, let’s go through the basics first and build a foundation that will make learning how to trade simple.
How to Read Crypto Charts
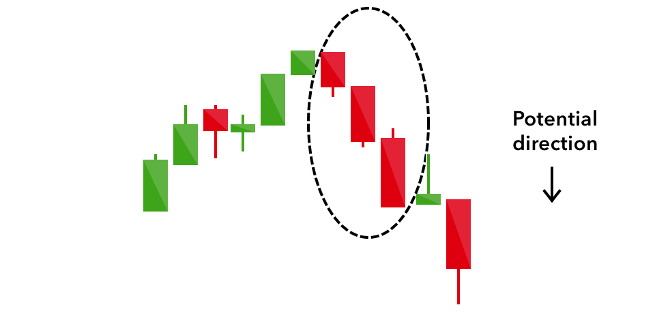
Candlestick charts appear in two forms, either as a bullish pattern or as a bearish pattern. A bullish pattern represents upward price movement and a bearish pattern represents downward price movement. It is important for you to fully understand bullish and bearish candlestick patterns, how to identify them, and how they influence market trends.
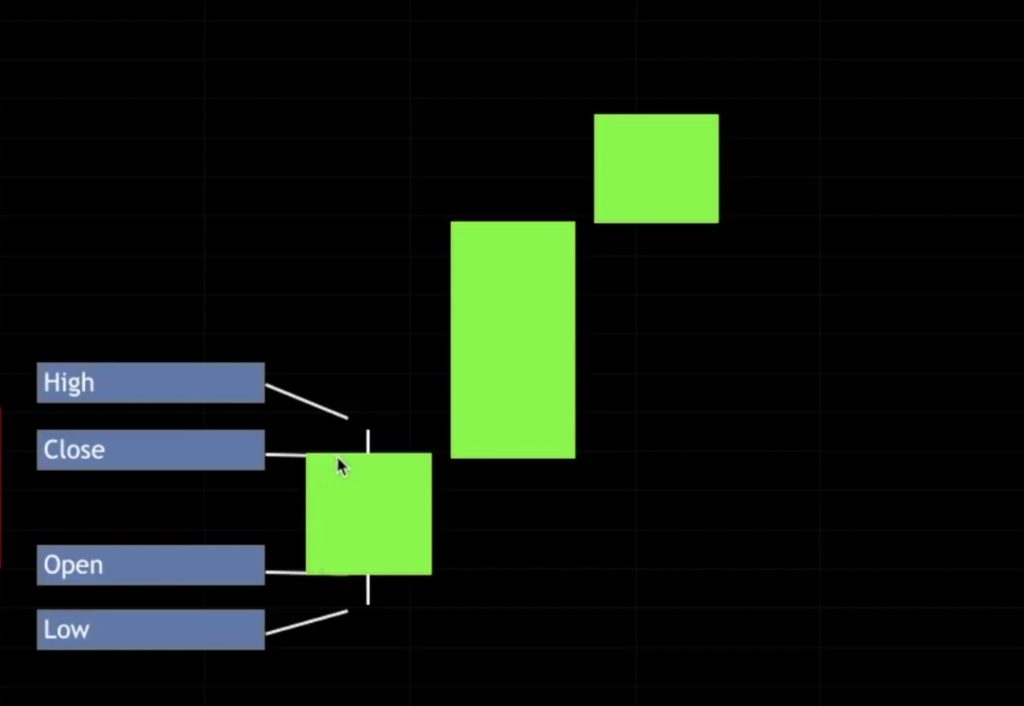
Bullish Candlesticks
A bullish candle is formed when the open price of a candle is lower than the closing price of the same candle. The candlestick indices and increase in price, and it is green in color.
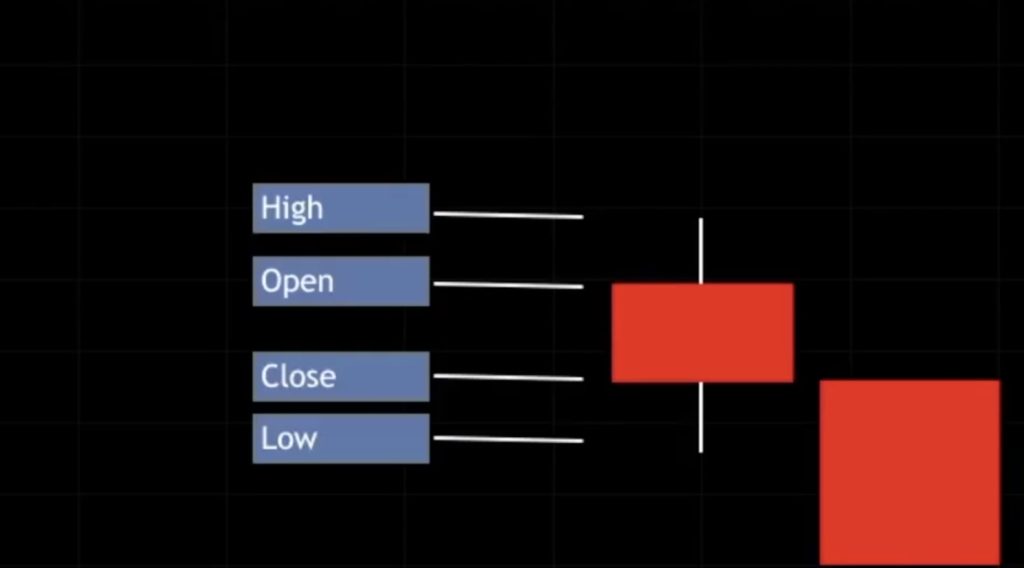
Bearish Candlesticks
A bearish candlestick is formed when the closing price of a candle is lower than the opening price. This candlestick indicates a price decline, and its color is red.
A candlestick can be formed within various timeframes. The daily (1Day) timeframe is one of the most popular timeframes that is used by crypto traders. A candlestick is formed (Price Opens) at the beginning of the day and will be fully formed (Price Closes) at the end of the day. The various candlesticks will be lined up next to one another, forming a 1 day candlestick chart.
The chart above is made up of various candlesticks within a 1-day timeframe. This means that each candlestick represents price action on a daily basis (every 24 hours). There are so many other chart timeframes.
Below are some of the most popular timeframes:
1-minute (1m)
5-minute (5m)
15-minute (15m)
30-minute (30m)
1-hour (1H)
4-hour (4H)
Daily (1D)
Weekly (1W)
Monthly (1M)
The smaller the time frame, the closer the price action can be looked at. It is just like zooming in on a chart. For instance, if you’re viewing the 1D (1 Day) chart similar to the one above. When you change the timeframe to a 1H (1 Hour) chart, the candlesticks present will be multiplied by 24. That is to say for every one 1D (1 Day) candlestick, you will have twenty-four 1H (1 Hour) candles.
If you now decide to switch to the 1W (Weekly) chart timeframe, where every candlestick represents a 7-day timeframe. Each 1D (1 Day) candlestick from the 1D timeframe will be combined in groups of seven, to form a single 1W (1 Week) candlestick. It’s like zooming out the chart.
Candlestick Chart Patterns
There are so many candlestick patterns that can be formed on a chart. When analysing a crypto chart, one will quickly realise that there are various types of patterns with many different candlestick arrangements. These include single, double, role, and quadruple candlestick patterns. In this article, our focus will be on the most popular and prominent candlesticks used by Crypto traders in generating profits from a trade.
All the candlesticks foretell price trends and momentum. Their functionality is to show price action, which includes data points that show the opening price, closing price, highest price and the lowest price of a cryptocurrency pair, or token.
Candlestick patterns occur often in the Cryptocurrency market. Candle structures are made up of 1 or more candles.
Single Candlestick Pattern
A single candlestick pattern contains only one candlestick. The most common single candle patterns are:
The Hammer Candle
The Inverted Hammer
The Hanging Man
A Shooting Star
A Doji
A Spinning Top
And a Spinning Bottom.
Double Candlestick Pattern
The double patterns are made up of two Japanese candlesticks. The most common types are:
Bullish engulfing
Bearish engulfing
Bullish harami
Bearish harami
Tweezer top
Tweezer bottom
Triple Candlestick Pattern
The triple candlesticks pattern contains 3 candlesticks, the most common types are:
Morning star
Evening star
3 white soldiers
3 black crows
There are so many other candle patterns that exist, with numerous complicated and simple candlesticks. You’ll come across them as you advance in your trading and investing journey. Let’s take a look at some of the most common candlestick patterns.
How to Read Candlestick Patterns
Candlesticks are technical indicators that combine price data and records for different periods into a single bar. Candlesticks form patterns that demonstrate the price action upon completion.
Traders can make decisions on trades with the information provided by candlestick patterns. These chart patterns are extracted from historical price action and trends.
In most cases, traders prefer to use the Japanese candlesticks on any given chart. This is because Japanese candlesticks are easier to read when it comes to the interpretation of trading periods. They reveal the open, close, high, low, and the variations between the open and close of each participant trade.
The Hammer Candlestick
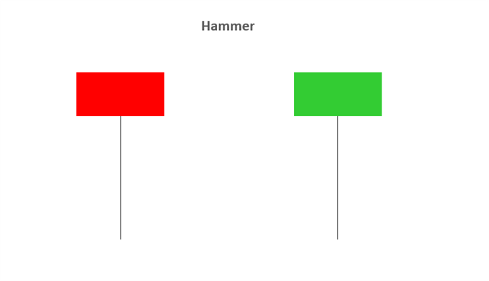
The hammer candle is a single candlestick pattern, and also a bullish reversal candlestick pattern. The shadow of the hammer candle’s wick is longer and lower, it is two times the length of the body of the candle. The candlestick pattern develops at the end of a downtrend indicating a price reversal. The body of this candlestick can sometimes be bullish or bearish, it is presumed to be more powerful when it is bullish.
Inverterd Hammer Candlestick
The inverted hammer candlestick is a single candle. The upper part of the candle wick is long while the lower part of the candle is small. Similar to that of the hammer candle, it appears during a bearish trend, indicating a price reversal.
The Hanging Man
This candlestick pattern is similar to that of the hammer, it emerges in a bullish trend and indicates the beginning of a new bearish trend.
The Shooting Star
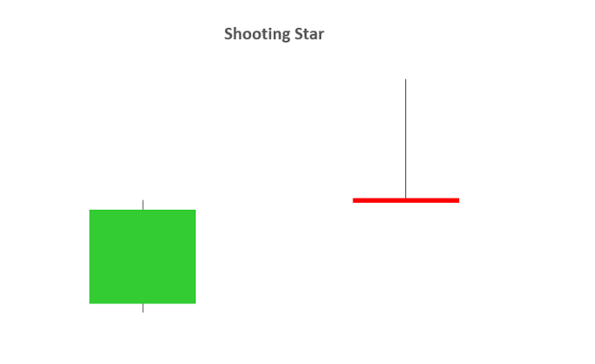
This is a single candlestick pattern that appears when there is an upward surge, it indicates a possible reversal. This candlestick has a long and upside wick that happens to be longer than the actual body. The body of the candle can appear as bullish or bearish, but the pattern is stronger when it is bearish.
Doji Candlestick
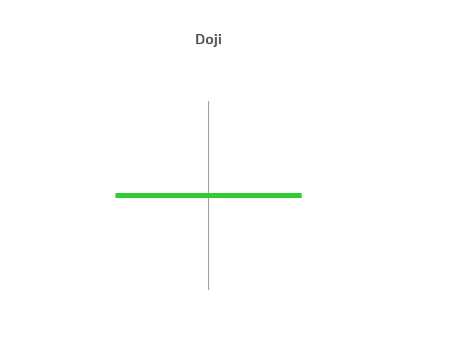
This is a popular single candlestick pattern with a very tiny body, the tip of the body is close to the open price. Doji consists of a long wick forged to it’s high and low. It indicates the change in sentiment of a trade.
The Bullish Engulfing Candlestick Pattern
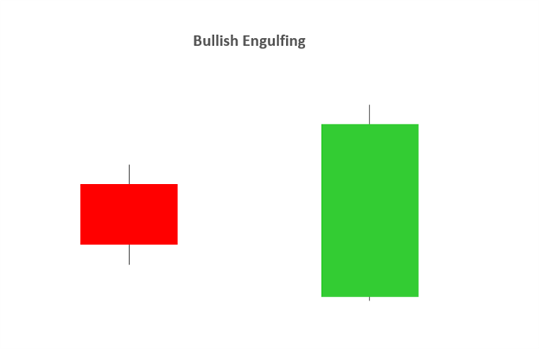
This candlestick is a double candlestick pattern, which indicates a trend reversal or strong uptrend. It predicts that the price of a security is moving beyond its prior highs and lows.
Bearish Engulfing Candlestick
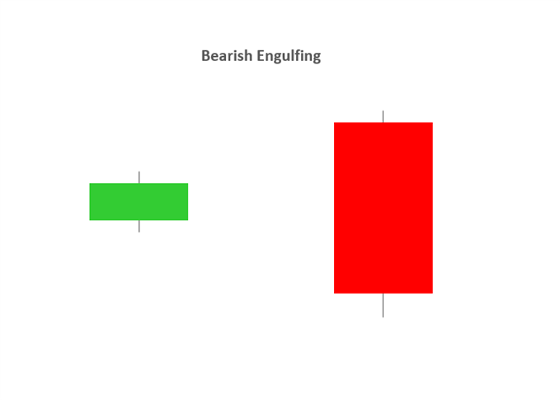
This is a candlestick pattern that is made up of two candlesticks with indicating colors of white, green, red, and black. It signals the lows of a price trend. It also signals the increase and decrease of price in a trade.
The Morning Star
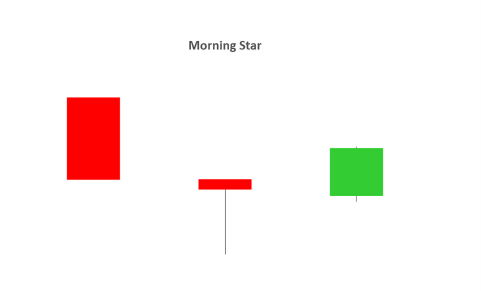
This is a visual candlestick pattern that consists of triple candlesticks. It appears during a downtrend and indicates the start of an uptrend. It shows a reversal candlestick pattern. It comprises tall black candlesticks that have long wicks and short bodies. One of the three candlesticks functions as a market survey.
The Evening Star
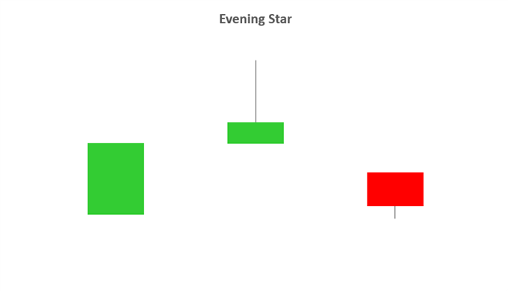
Similar to the morning star candlestick, it is a triple candlestick pattern that appears at the end of an uptrend. It signals a price reversal pattern. One of its candlesticks also surveys the market trends.
The Dark Cloud Pattern
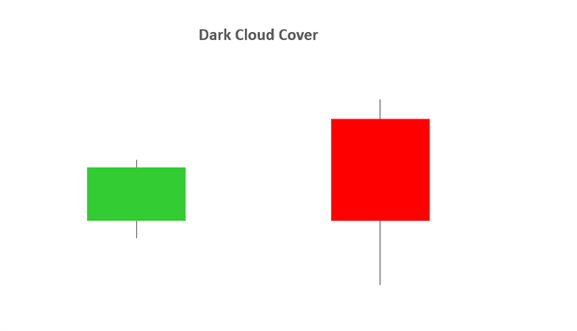
This candlestick pattern is a bearish reversal pattern that shows the change in a market’s momentum. It comprises one bearish candlestick and one bullish candlestick. The bearish candlestick closes after the midpoint. It signals and confirms the decline of the market’s price.
The Peircing Line Pattern
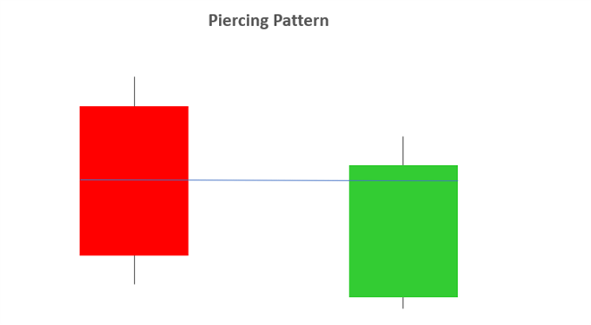
The potency of this candlestick is decreased because it can appear at any point, but it mainly shows up at the end of a downward trend. The signal strength is not strong, and it is used to substantiate a future trade.
The Three Black Crows Pattern
This is a triple pattern candlestick. It appears at the end of an uptrend after there has been an enormous unstable momentum. It is a reversal pattern that provides a strong signal which indicates a take-profit action. This pattern suggests that there is an increase in the price of a commodity due to the influx of sell orders.
Deciphering single candle formations
Single candlesticks provide a lot of knowledge on the present market sentiment. Candlesticks such as Hammer, shooting star, and hanging man, provide signals when there is a change in momentum and especially indicate the point of a future market price trend.
The image of the Hammer candlestick above indicates a reversal trend. The formation of the candle has a long won’t wick with a tiny body. The closing price is located on top of the opening price. The perception behind the formation of this candle is simple, the price tried to fall but the influx of buy orders by the buyers increased the price of the market.
Overview on Reading A Candlestick Chart
There are so many methods to utilize and read a candlestick chart. Candlestick chart survey is based on your trading strategy m and time-frame. Some trading methods are based on candle formations while others are based on price patterns.
Final Thoughts
By this point, you have discovered the following:
- Candlestick charts give you more information than simple line charts.
- Every candlestick shows the opening, closing, highest and lowest price (OHLC) of a selected timeframe.
- A green candlestick represents a bullish (rising) candle and a red candlestick represents a bearish (falling) candle.